Hello, fellow travelers! In this post, I want to share with you some insights from my recent road trip to Glacier National Park, one of the most stunning places in Montana. I also want to show you how you can use Tripsta, a handy app that tracks your speed, distance, and altitude, to understand your driving patterns and optimize your travel time.
Glacier National Park: A Hiker’s Paradise
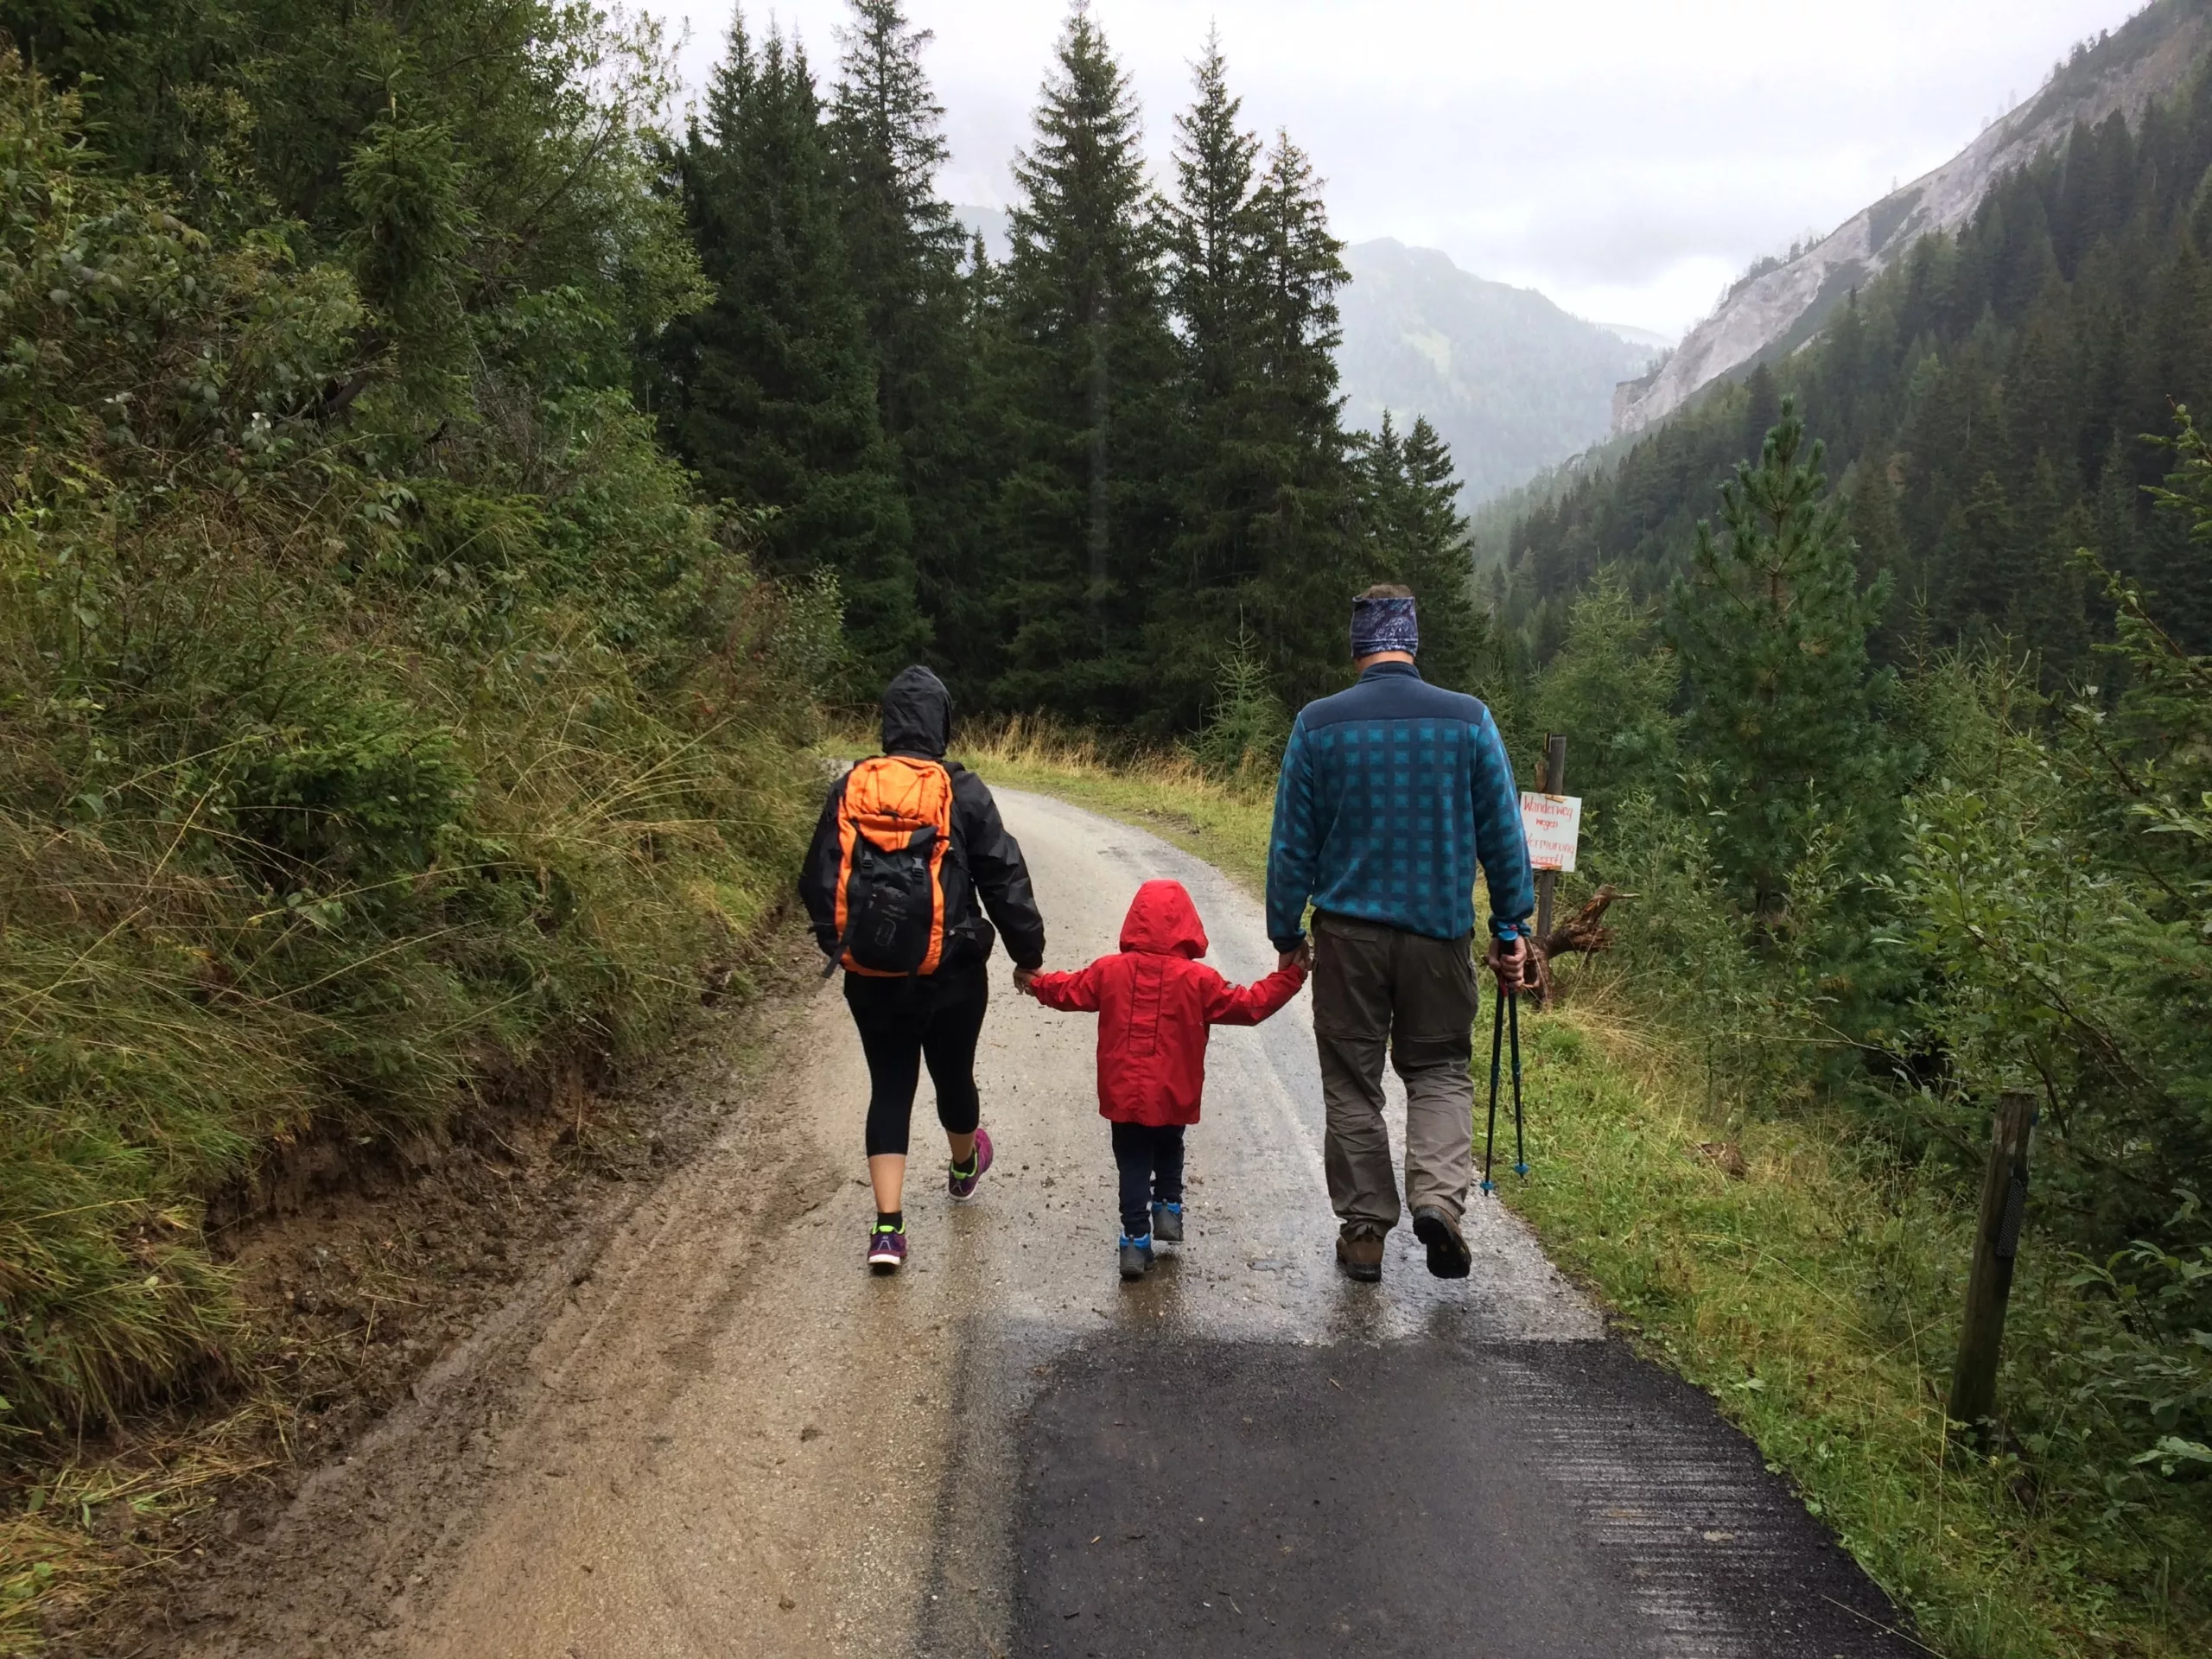
My family and I love hiking, so we decided to visit Glacier National Park for our summer vacation. The park is home to over 700 miles of trails, ranging from easy to challenging, and offers breathtaking views of mountains, lakes, and wildlife. We spent three days exploring different parts of the park, and we had a blast!
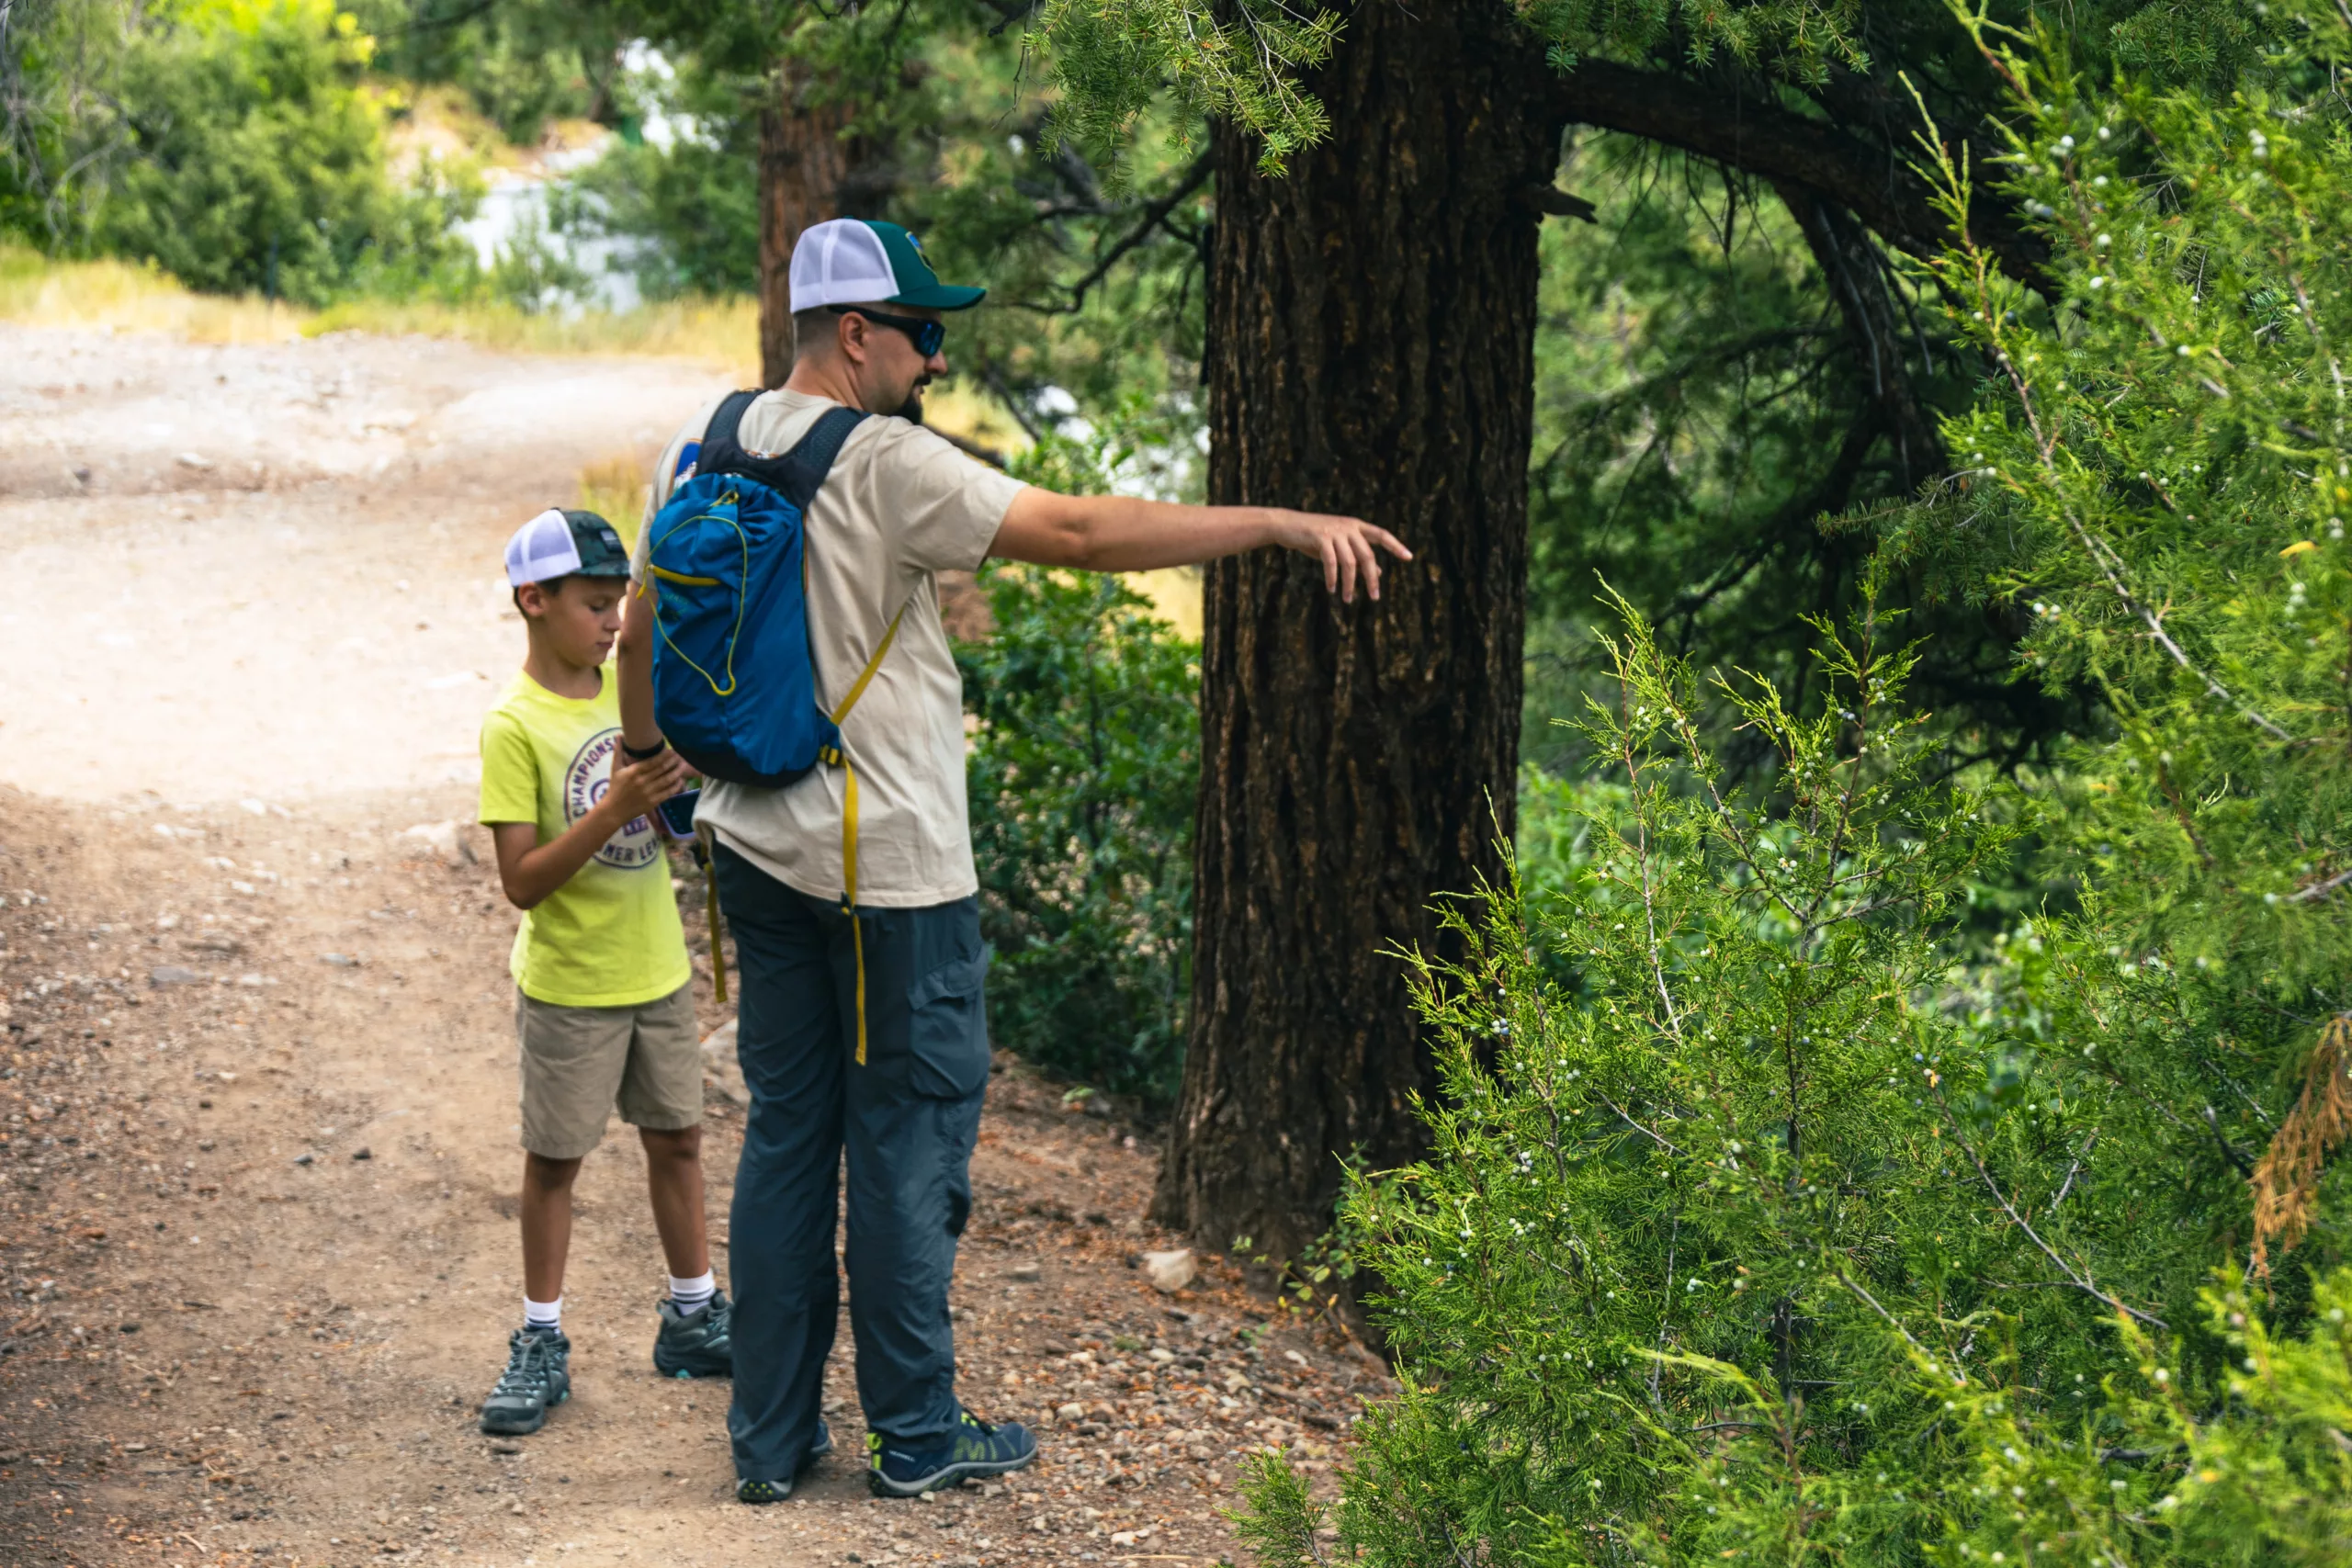
One of the highlights of our trip was meeting this friendly lad who posed for a portrait. He was so curious and adorable!

Tripsta: A Smart App for Road Trippers
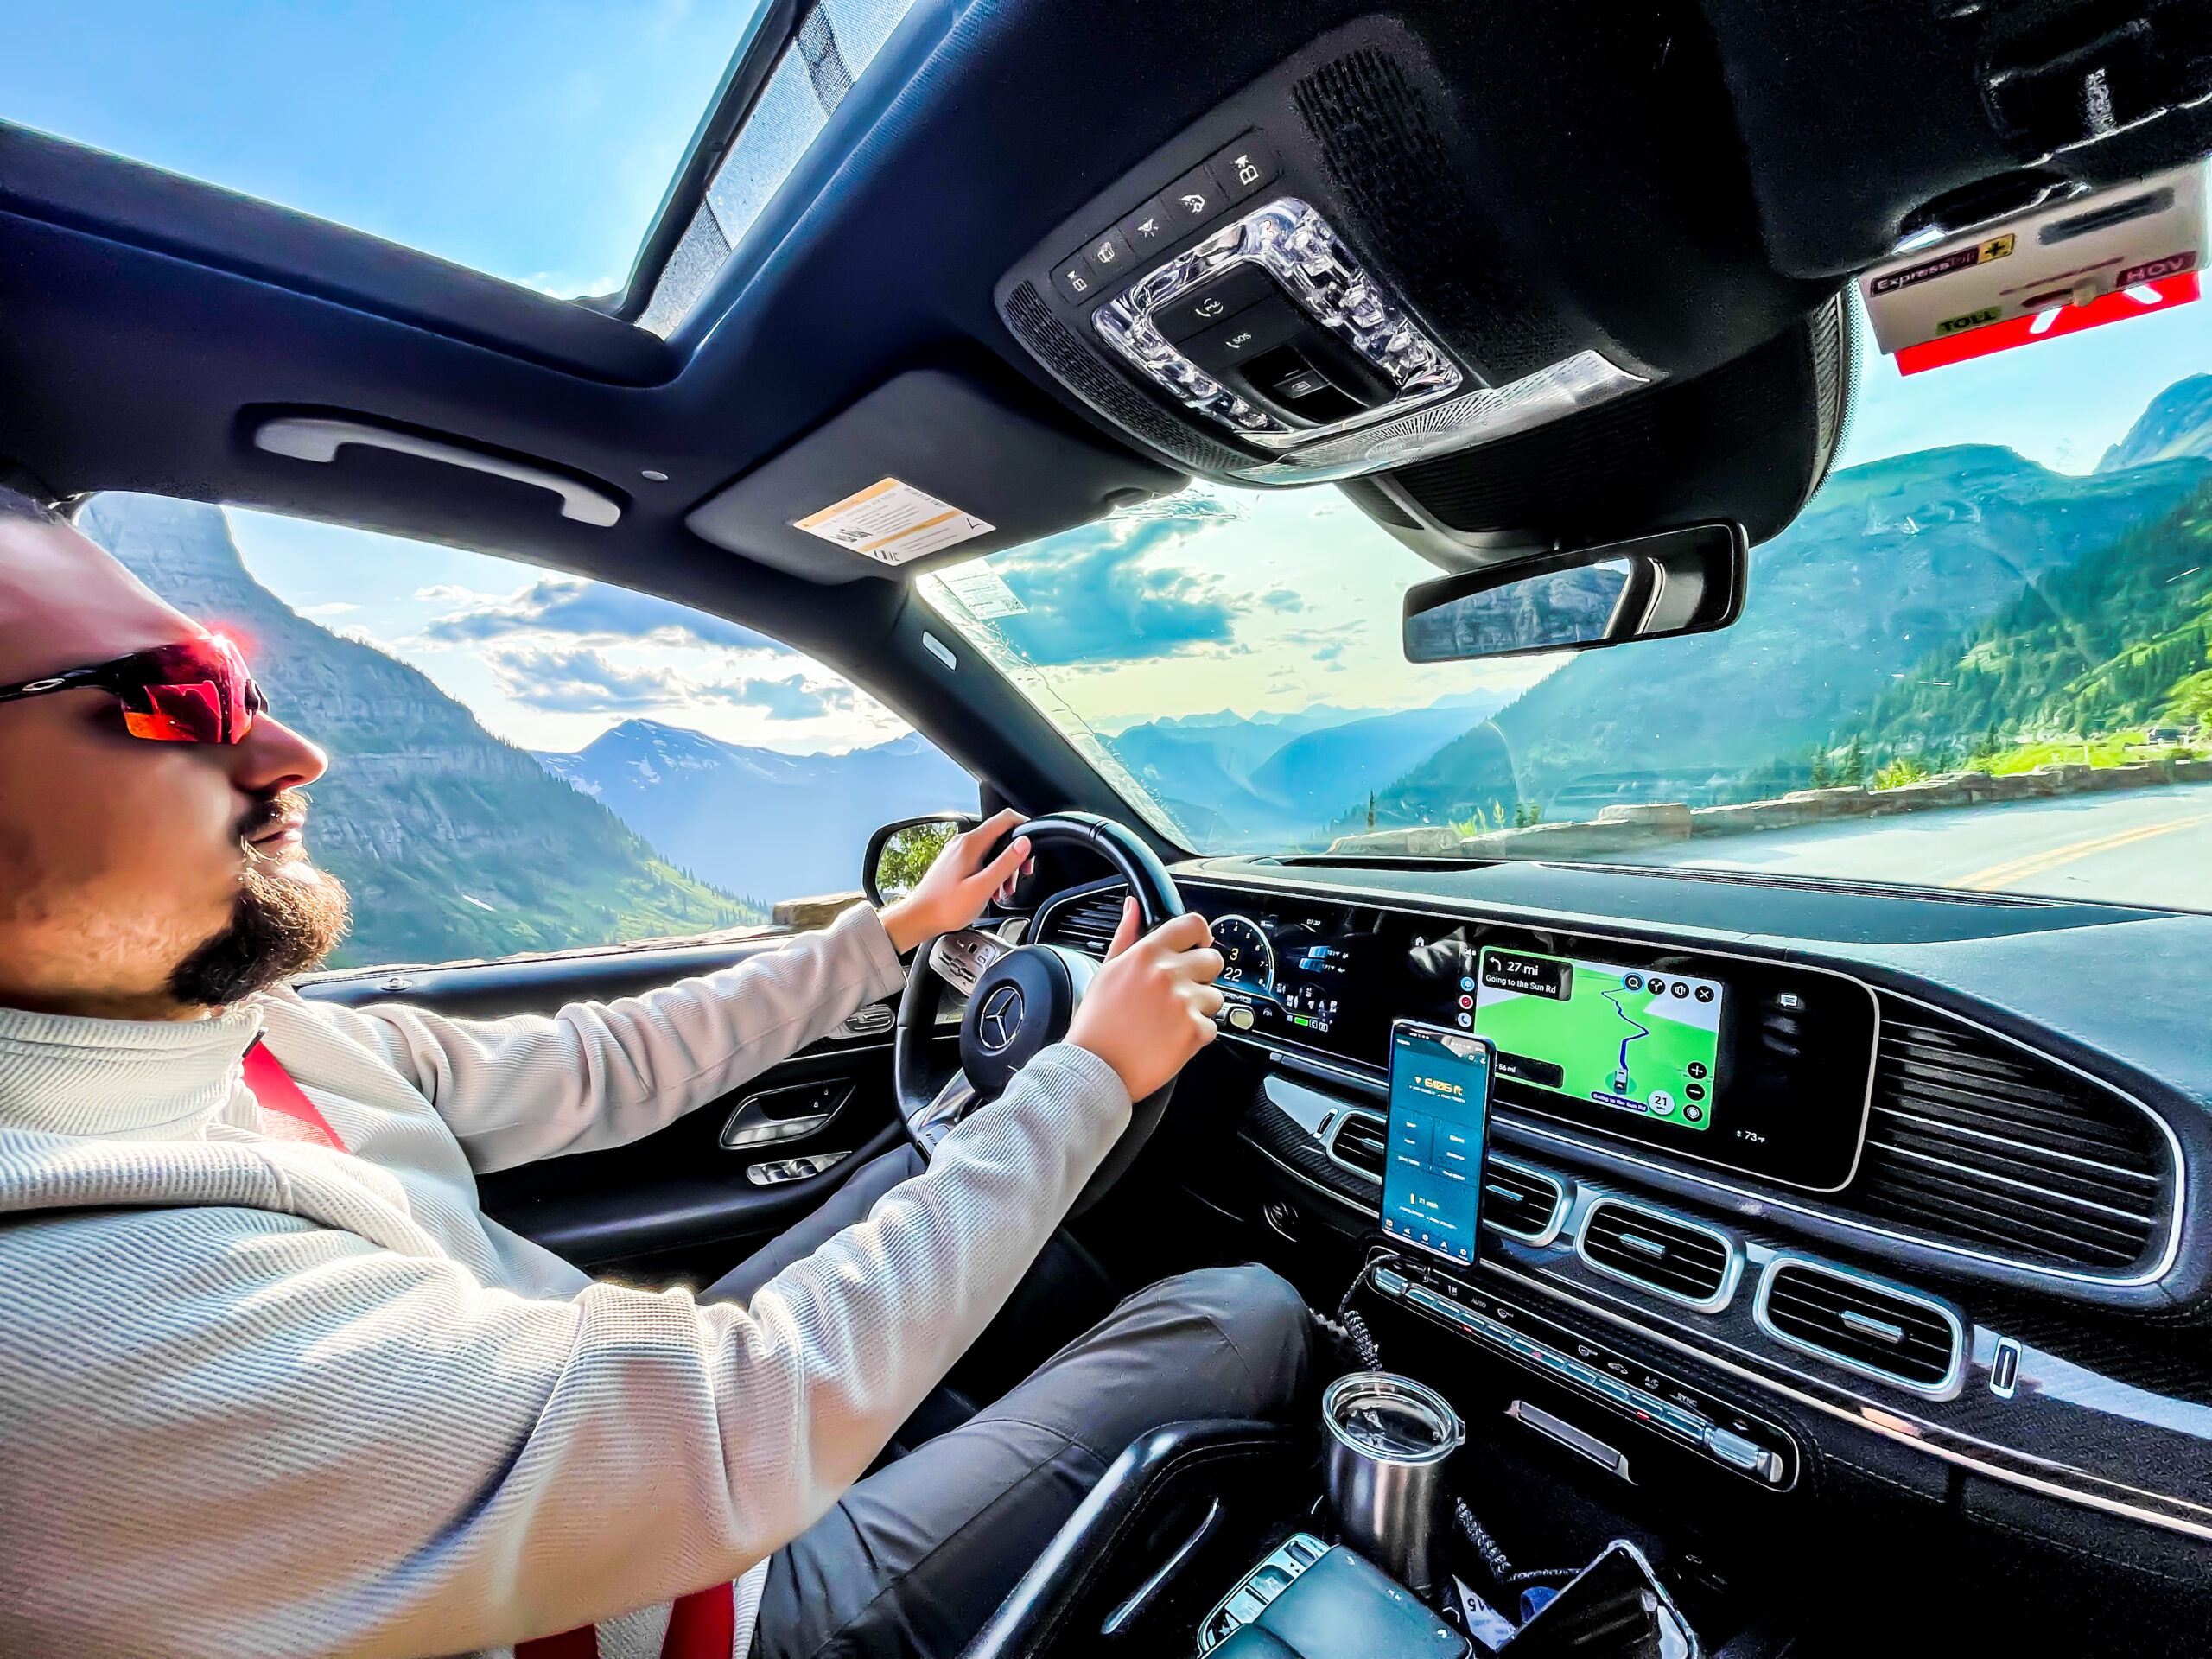
After our amazing time at Glacier National Park, we had to drive back home. It was a long journey, so I decided to use Tripsta, an app that I downloaded before the trip, to track my driving data. Tripsta is a great tool for road trippers who want to monitor their speed, distance, and altitude during their travels. It also generates graphs and maps that help you visualize your data and identify any issues or inefficiencies.
For example, on the first day of our drive back home, I covered 782 miles in 11 hours and 17 minutes. That’s not a very impressive speed, right? Well, thanks to Tripsta, I was able to figure out why I was driving so slow (spoiler alert: we stopped for dinner for almost 2 hours).

Here are some screenshots from Tripsta that illustrate how I analyzed my data:

On the speed graph, we can see that my speed hits 0 twice. The first one is when I stopped at a gas station to refuel and stretch my legs. The second one is when we stopped for dinner at a nice restaurant. Both stops were necessary and enjoyable, but they also added a lot of time to our travel.

On the altitude graph, we can also notice that the altitude didn’t change for quite some time. This may also implicitly point to the fact that the tracking device was stationary. In other words, when the altitude is flat, it means that I’m not moving.
Conclusion: How to Use Tripsta to Improve Your Road Trips
By using Tripsta, I was able to gain some valuable insights into my driving habits and preferences. I learned that I like to take long breaks during my road trips, which is fine as long as I plan ahead and account for them in my schedule. I also learned that I tend to drive faster when the terrain is flat and slower when it’s hilly or curvy.
Tripsta helped me understand how I can improve my road trips by adjusting my speed, route, and stops according to my goals and needs. For example, if I want to save time, I can choose a flatter route and shorten my breaks. If I want to enjoy the scenery, I can choose a more scenic route and take longer breaks.
If you’re interested in trying Tripsta for yourself, you can download it from the App Store or Google Play. It’s free and easy to use. Just install it on your phone or tablet, mount it on your dashboard or windshield, and start your trip. Tripsta will do the rest!
I hope you enjoyed this post and found it useful. If you have any questions or comments about Tripsta or Glacier National Park, feel free to leave them below. Happy travels!